
Dental Practice Financial Planning Template: The 2026 Strategic Blueprint

A static spreadsheet only records past losses; it doesn't build enterprise value. Most practice owners spend hours dissecting backward-looking profit and loss statements, yet they remain blind to the operational levers that drive sustained margin expansion. When you implement an operator-grade dental practice financial planning template, dynamic financial modeling replaces historical guesswork by tying chairside capacity directly to clinical overhead, daily scheduling throughput, and net collections.
You already know the frustration of watching ballooning administrative payroll, rising supply costs, and shifting insurance adjustments quietly compress your clinical profit margins. Planning an associate hire, adding operatories, or scaling into a group practice shouldn't feel like an expensive gamble based on incomplete data. This 2026 strategic blueprint delivers the exact framework you need to master clinical cash flow, benchmark practice expenses against elite industry standards, and build a forecast engineered for long-term valuation. Ahead, we will walk through the structural disciplines required to turn your practice data into an actionable engine for EBITDA growth.
Key Takeaways
- Shift from backward-looking P&L reviews to a forward-looking operational compass that translates daily chairside capacity into predictable cash flow.
- Benchmark critical practice expenditure categories against elite industry standards to stop runaway overhead from quietly eroding clinical margins.
- Deploy a dynamic dental practice financial planning template to model available doctor and hygiene chairside hours against realistic insurance adjustments.
- Uncover dynamic operational friction points, such as front-desk bottlenecks and case presentation fallout, that traditional static spreadsheets fail to track.
- Bridge the gap between proforma targets and clinical reality through centralized infrastructure, virtual staffing, and scalable DSO-ready operational systems.
Core Architecture of an Operator-Grade Dental Practice Financial Planning Template
Traditional accounting looks backward. It tallies historical invoices, reconciles past credit card transactions, and delivers an autopsy of the previous month. An operator-grade dental practice financial planning template functions differently. It serves as a forward-looking operational compass that links your clinical schedule directly to cash availability. Just as the core architecture of a business plan establishes structural direction, a dental financial template aligns daily operatory capacity with long-term fiscal solvency.
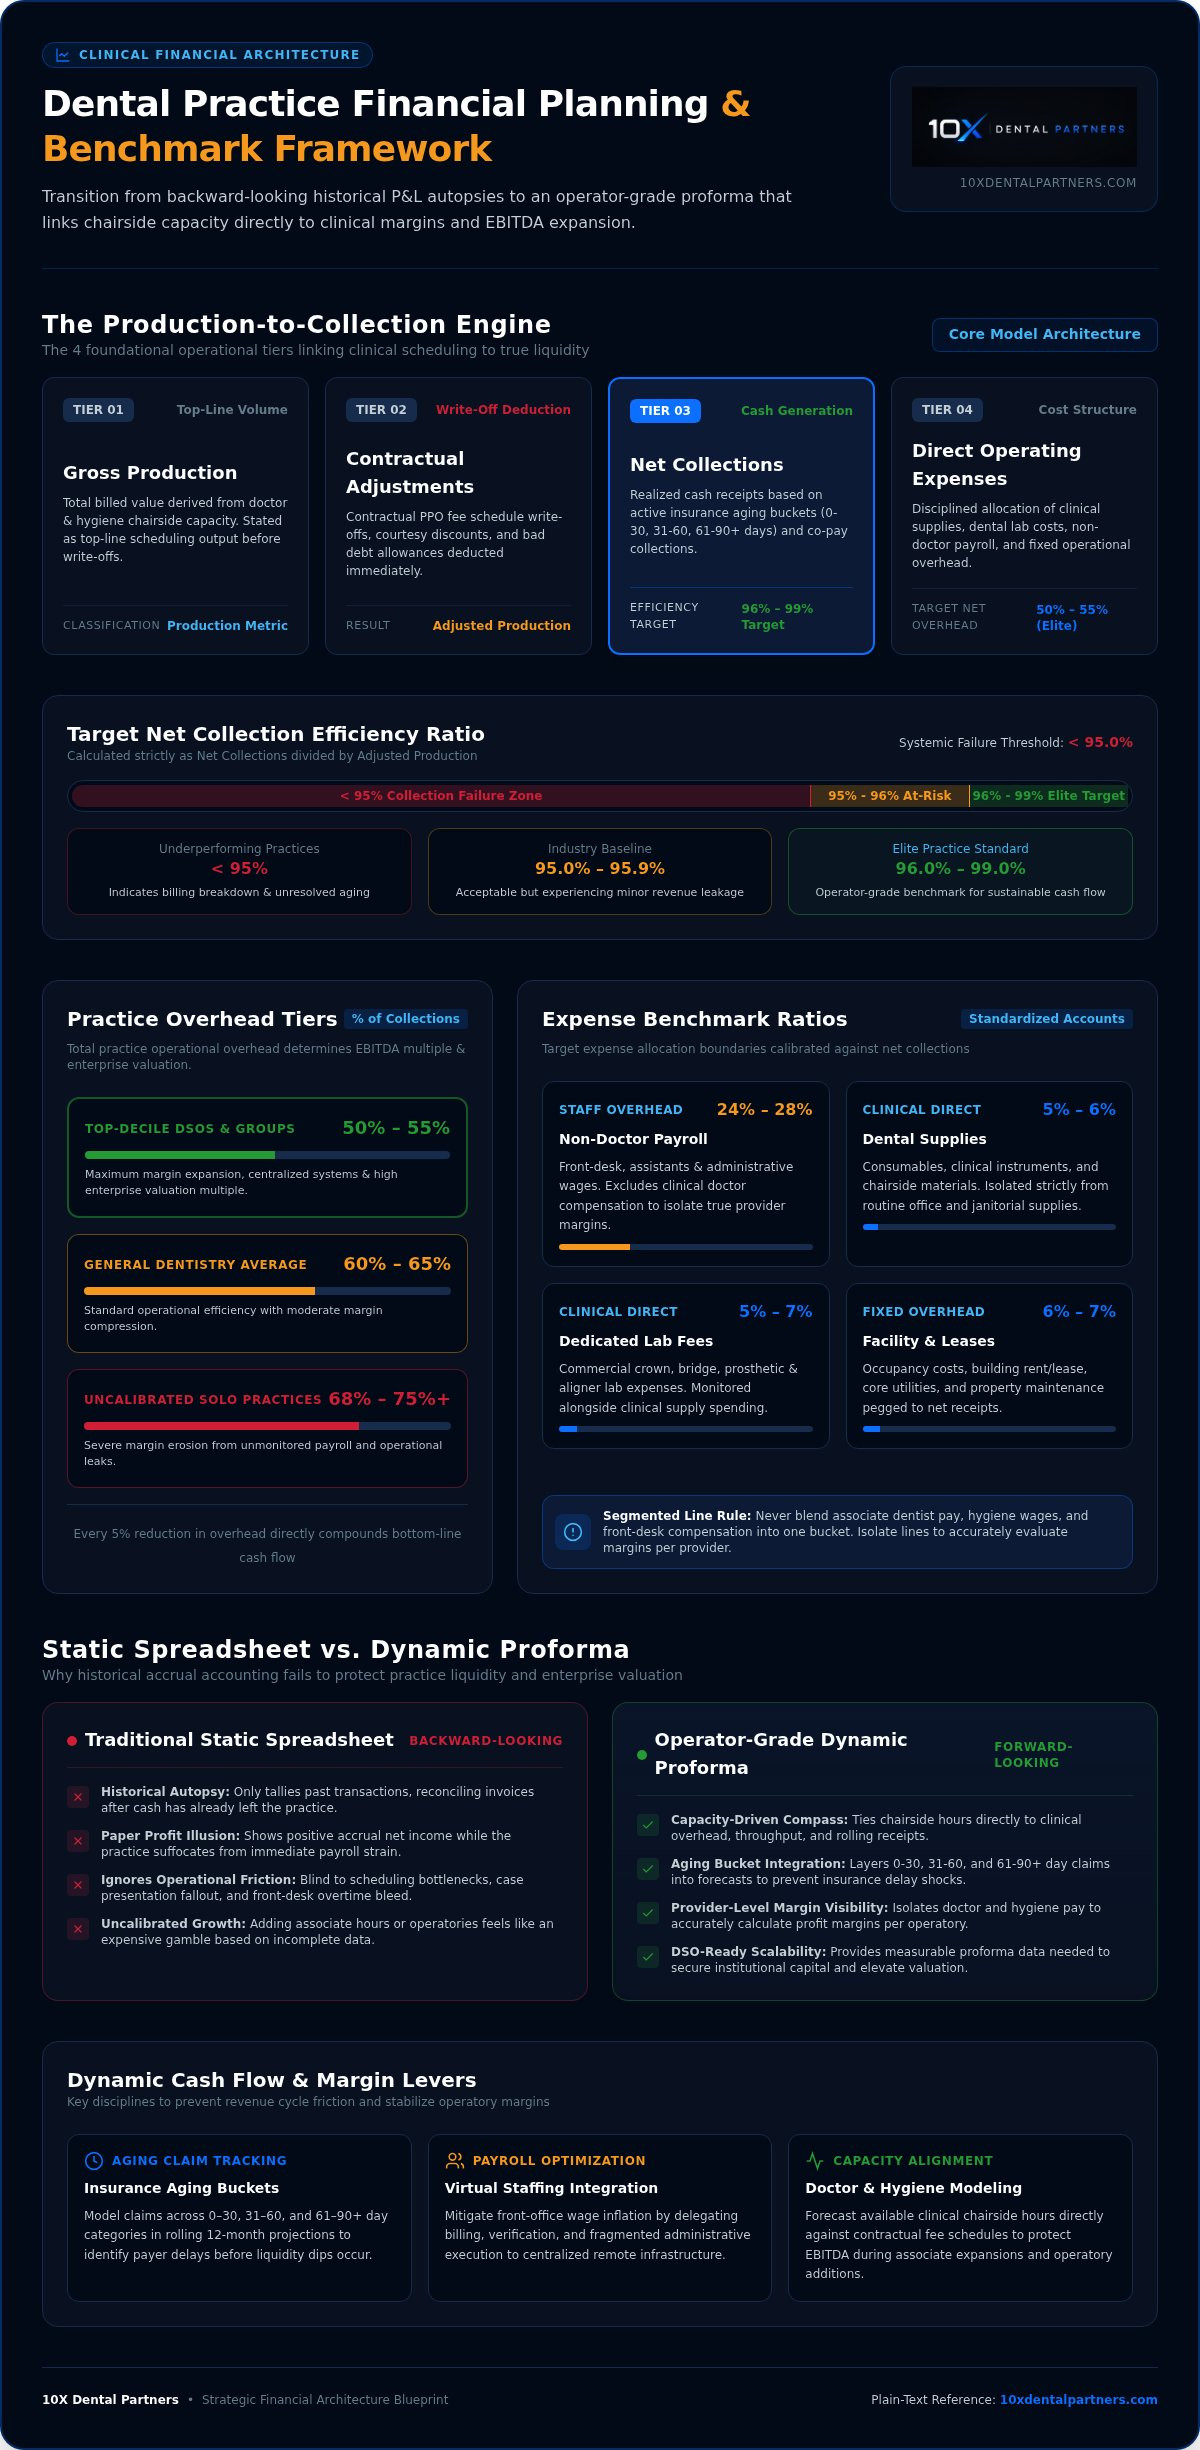
There is a massive distinction between paper accounting profit and true operational cash flow. You can show positive net income on an accrual profit and loss statement while suffocating from payroll strain. Dental revenue faces real friction: delayed insurance adjudications, split co-pays, and seasonal patient cancellations. To protect liquidity during predictable volume dips, your template must model four core tiers dynamically: Gross Production, Contractual Adjustments, Net Collections, and Direct Operating Expenses.
The Production-to-Collection Engine
Gross production is vanity; collected revenue pays the bills. Your model must immediately strip out contractual PPO write-offs and bad debt allowances to calculate true adjusted production. Elite practices benchmark target net collection ratios strictly between 96% and 99% of adjusted production. Anything below 95% points to systemic collection failures. Layer your insurance aging buckets (0-30, 31-60, and 61-90+ days) directly into short-term rolling cash receipts forecasts so you never get blindsided by insurer delays.
Chart of Accounts Standardization for Dental Operations
Clean operational visibility requires structuring your chart of accounts into three disciplined cost buckets:
- Clinical Direct Costs: Isolate clinical dental supplies and dedicated laboratory expenses from routine office purchases. Clinical supplies should track between 5% and 6% of net collections, while lab fees target 5% to 7%.
- Facility & Fixed Overhead: Group occupancy, facility leases, and core utilities, keeping them pegged tightly to 6% to 7% of net collections.
- Segmented Personnel Expenses: Never blend clinical provider compensation with non-clinical wages. Associate dentist pay, hygiene wages, and front-desk administrative compensation require isolated lines to evaluate accurate margins per provider. Include modern practice management software subscriptions and digital tools under administrative infrastructure.
Separating these lines turns your financial blueprint into an actionable diagnostic dashboard.
Key Dental Benchmark Ratios to Calibrate Your Financial Proforma
A dynamic model requires strict boundaries. If you don't calibrate your financial proforma against proven ratios, minor operational leaks quickly swallow clinical cash. Across general dentistry, average overhead sits between 60% and 65% of net collections, while uncalibrated solo practices often see overhead blow past 68% to 75%. Top-decile groups and high-performing DSOs operate between 50% and 55% overhead. That difference transforms your take-home margins. It also dictates your enterprise valuation multiple when pitching lenders or institutional buyers. As noted in standard government guidance on business plans, structured financial forecasting creates the measurable baseline required to secure capital and sustain expansion.
Every dynamic dental practice financial planning template must benchmark three foundational pillars against elite operational standards:
Personnel and Staffing Overhead Thresholds
Total non-doctor staff payroll must stay locked between 24% and 28% of net collections. When front-office wage inflation goes unchecked, admin payroll eats your bottom line without adding clinical capacity. Solo practices frequently bleed cash here through front-desk overtime, scheduling bottlenecks, and fragmented administrative task execution. Integrating virtual staffing for dental offices provides a decisive margin-protection lever. Shifting billing, insurance verification, and intake to centralized off-site specialists helps practices pull payroll below 25% while maintaining support.
Clinical Supply and Laboratory Cost Allocation
Clinical dental supplies should consistently track between 5% and 6% of net revenue. When dental supplies rose 6% over twelve months leading into early 2026, practices without strict inventory triggers absorbed immediate margin compression. Commercial laboratory expenses must run between 5% and 7% of collections. If combined lab and supply costs exceed 14%, your template must trigger an operational review of vendor pricing, clinical waste, or procedure mix.
Facility and General Administrative Expense Caps
Fixed occupancy, including rent, facility maintenance, and property taxes, should not exceed 7% of net collections. Limit general administrative overhead, IT subscriptions, merchant processing, and patient acquisition costs to 8% to 10%. Maintaining these strict expense thresholds yields an adjusted EBITDA margin of 20% to 25%, establishing a rock-solid foundation for enterprise scaling. If you want an expert evaluation to see where your numbers stack up against top performers, a consultation through 10X Dental Partners can help calibrate your baseline targets.
Deploying the Rolling 12-Month Forecasting Template
Setting an annual budget in January and ignoring it until tax season guarantees operational drift. A practical dental practice financial planning template operates on a rolling twelve-month basis, continually incorporating actual performance numbers to sharpen future projections. This active modeling approach converts static practice management metrics into real-time operational course corrections. By linking weekly chairside output directly to dynamic expense targets, you replace reactive bookkeeping with deliberate enterprise management.
Executing this forecasting discipline follows an interconnected four-step sequence:
Step 1 & 2: Baseline Clinical Capacity and Historical Trend Audit
Begin by auditing your trailing twelve months (TTM) collections, contractual write-offs, and true chair utilization. Next, calculate real capacity. Determine available clinical chairside hours for every doctor and hygienist by multiplying working days by daily chair hours. Apply realistic production-per-hour targets against historical schedule density to model maximum output. High-performing practices aim for over $300,000 in revenue per operatory. Mapping these figures reveals clear seasonal dips, such as late summer lulls, letting you adjust cash reserves well before revenue contracts.
Step 3 & 4: Variable Cost Modeling and Rolling Monthly Reconciliation
Variable costs fluctuate directly with procedure volume. As production scales up or down, your lab and clinical supply projections must automatically recalibrate rather than staying fixed. Close every month with a strict variance audit comparing actual expenses against your budgeted thresholds. When actual performance lags behind projections, partnering with strategic dental practice growth consulting helps diagnose operational constraints, unblock clinical schedules, and systematically elevate provider output.
A rolling forecast functions as an executive dashboard. It highlights exactly where clinical capacity meets financial reality, ensuring your operational roadmap actively drives cash flow.
Where Traditional Financial Spreadsheets Fail Growing Practices
Spreadsheets provide structure, but they don't drive execution. Many clinic owners download an advanced dental practice financial planning template expecting it to instantly salvage eroded margins. A formula cannot fix broken operational workflows. When relying strictly on static Excel sheets, human data-entry bottlenecks inevitably distort your clinical key performance indicators. By the time front-desk staff manually reconciles production figures from your practice management software, you are managing off obsolete numbers.
The Disconnect Between Financial Projections and Chairside Execution
Static spreadsheets assume ideal patient behavior and consistent treatment conversion. Reality operates differently. While an aggressive proforma might project strong revenue growth, actual industry case acceptance averages between 34% and 40%, far below the typical 90% target. Disconnected financial models blind operators to uncollected treatment pipelines, broken follow-up cadences, and silent patient churn. A dental practice financial planning template only delivers reliable ROI when synchronized with disciplined frontline systems that secure chairside commitments.
The Margin Trap of In-House Administrative Overhead
Attempting to fix operational complexity by simply adding more physical front-office staff creates a dangerous margin trap. Physical administrative payroll quickly inflates your fixed cost base through recruitment friction, ongoing turnover, and front-desk clutter. Scaling practice capacity profitably requires decoupling administrative task volume from local chairside payroll. If you are reviewing your expansion runway, study the operational mechanics of transitioning from solo to group dental practice. Centralized systems, automated patient workflows, and remote administrative infrastructure preserve operating leverage as patient volume multiplies.
To eliminate operational friction and align your financial projections with predictable execution, partner with 10X Dental Partners to build scalable infrastructure that protects your EBITDA.
Scaling Beyond the Spreadsheet: Building Enterprise Value with 10X Dental Partners
A well-calibrated dental practice financial planning template serves as an essential diagnostic blueprint, but financial architecture requires operational execution. Having target expense percentages on a screen means nothing if your front office remains buried under administrative drag or if clinical operatories run below capacity. 10X Dental Partners bridges the divide between theoretical proformas and daily clinical throughput, transforming static financial modeling into durable enterprise value.
Operationalizing the Financial Plan with Centralized Infrastructure
Hitting target payroll thresholds without degrading patient experience requires structural separation between clinical delivery and administrative execution. Deploying 10X Remote Assist stabilizes front-desk overhead, absorbing insurance verification, claim tracking, and schedule maintenance so chairside staff can focus entirely on patient care. To achieve aggressive revenue targets, practices integrate centralized call center operations with The Closing Experts, systematically lifting conversion rates on high-value treatment plans. For practices targeting surgical expansion, specialized revenue engines like Fast Arches install the exact operational protocols required to scale full-arch restorative procedures profitably.
Architecting for Multi-Location Scale and DSO Transition
Transitioning from a single thriving location into a multi-site group introduces exponential operational complexity. Multi-entity expansion demands consolidated visibility where each site's rolling forecast feeds directly into an executive dashboard. Aligning your dynamic dental practice financial planning template with comprehensive DSO infrastructure development ensures standardized billing, unified charts of accounts, and centralized talent acquisition across every location. This architectural rigor protects operating margins during rapid expansion, turning predictable financial forecasts into reliable, investor-grade EBITDA that commands top valuation multiples.
Execute Your Strategic Growth Blueprint
Financial mastery isn't achieved by staring at backward-looking tax reports. Sustainable clinical expansion requires tying operatory capacity directly to disciplined overhead benchmarks and dynamic rolling forecasts. While deploying an operator-grade dental practice financial planning template establishes your strategic baseline, long-term valuation depends on flawless operational execution across every chair and location.
Reaching elite EBITDA margins demands proven systems that eliminate frontline friction. By pairing specialized growth consulting and remote administrative staffing with proprietary case conversion programs like The Closing Experts, you turn treatment plan pipelines into realized net cash flow. When you're ready to scale, proprietary DSO infrastructure frameworks keep overhead locked down as patient volume grows.
Take control of your clinical margins today. Turn your financial model into scalable enterprise growth with 10X Dental Partners and build the enduring enterprise your practice deserves.
Frequently Asked Questions
What is the most critical metric in a dental practice financial planning template?
Net collection percentage relative to available chairside capacity is the core operational metric. While gross production shows clinical volume, cash survival depends on collecting 96% to 99% of adjusted billings. An effective dental practice financial planning template tracks revenue per operatory hour rather than gross totals, ensuring every available chair covers its fixed overhead and drives targeted margin contribution.
How much working capital should a dental practice model into its financial plan?
Practices should maintain a cash reserve equal to one and a half to three months of recurring operating expenses. This cushion protects payroll, lab payments, and facility rent during insurance adjudication delays or seasonal volume drops. For practices executing an aggressive multi-chair expansion, holding at least two full months of fixed overhead provides the liquidity needed to absorb marketing ramp-up and initial staffing costs safely.
What is a healthy overhead percentage for a scaling dental practice in 2026?
A healthy overhead target for an expanding practice ranges between 55% and 62% of net collections, excluding owner compensation. Solo practices often allow expenses to climb past 68%, which severely compresses take-home earnings. High-performance dental organizations leverage centralized administration and virtual front-office systems to compress non-doctor payroll below 25%, anchoring total operational overhead near 50% to 55% to maximize free cash flow.
How often should our dental practice update and reconcile our financial plan?
Reconcile production, collections, and labor hours weekly, while conducting a formal variance review at the close of every month. Annual budgets become obsolete quickly when clinical schedules fluctuate. Running a monthly rolling review allows operators to compare actual QuickBooks ledger entries against budgeted line items, identifying unexpected supply spikes or billing delays before small variances turn into major cash deficits.
How does a financial planning template handle PPO adjustments and insurance write-offs?
A dynamic dental practice financial planning template separates gross production fees from contracted insurance allowances on dedicated lines. Rather than forecasting off full fee schedules, the model calculates net adjusted production by factoring in historical write-off percentages, typically 25% to 40% in PPO-heavy clinics. This prevents artificial revenue inflation and establishes realistic figures for budgeting variable dental supplies and provider commissions.
What is the best way to model associate dentist compensation inside the budget?
Model associate compensation as a direct clinical variable expense pegged strictly to individual net collections or adjusted production, typically between 30% and 35%. Never blend provider pay into administrative payroll or facility overhead. Isolating doctor compensation alongside designated hygiene pay gives leadership an unclouded view of clinical gross profit margins, ensuring the practice earns an acceptable return on operatory chair time.
Can a financial planning template prepare my practice for DSO acquisition or private equity?
Yes. Institutional buyers and DSO acquisition teams evaluate businesses on adjusted EBITDA quality, predictable cash flow, and standardized reporting. A structured model removes non-recurring personal expenses, categorizes provider wages properly, and proves consistent operating margins across locations. Establishing these financial systems early demonstrates operational discipline, helping you command premium valuation multiples when presenting your platform to lenders or equity partners.


